1. Introduction
Our team consists of 4 members: Antonius, Siebe, Nathan and Kirsten. All of us are students at the Stedelijke Humaniora Dilsen. Siebe studies Science-Mathematics, with six hours of math. The others all study computer science.
2. Project description
2.1 Mission overview
Our primary mission will be to measure the height, atmospheric pressure and temperature using a sensor called the BMP280 and sending this data wireless to our laptop in real time with a radiofrequency transceiver module (RFM69HCW). With this mission we also need to get our Cansat on the ground safely using an annular parachute. We will also be putting a GPS-tracker in our Cansat so we can find it after touchdown.
2.2 Secondary Mission
We are going to measure the carbon monoxide concentration in the atmosphere. We will use the MQ-7 sensor from Waveshare. We chose this one because it can be connected to the Raspberry Pi Pico. In the past we have already worked with products from waveshare so we know that it is a good brand. The sensor is made to measure CO, so it is the perfect sensor for our secondary mission.
2.3 Mechanical design
2.3.1 Parachute Design
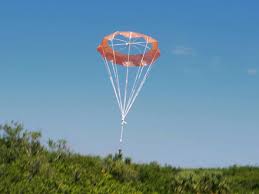
The area of our parachute has been calculated using the formula from the presentation (A = 2mg/CDρv²). Our team made the calculations using different numbers for the weight, drag coëfficient and velocity. We figured out that the ideal area for the parachute to reach a velocity of 8m/s is 0.863m². As we are going to make an annular parachute which means the drag coefficient of the parachute will vary between 0.85 and 0.95, as a margin of safety the lower drag coefficient of 0.85 was used.
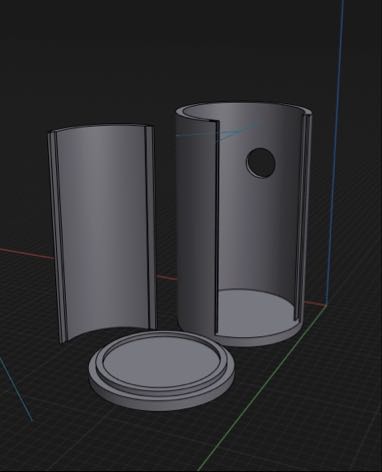
2.3.2 Can Design
The can is a 3D printed cylinder, with a small cutout at the top to accommodate a lid which fits seamlessly allowing us to seal the can thus containing our equipment.
2.4 Electronic design
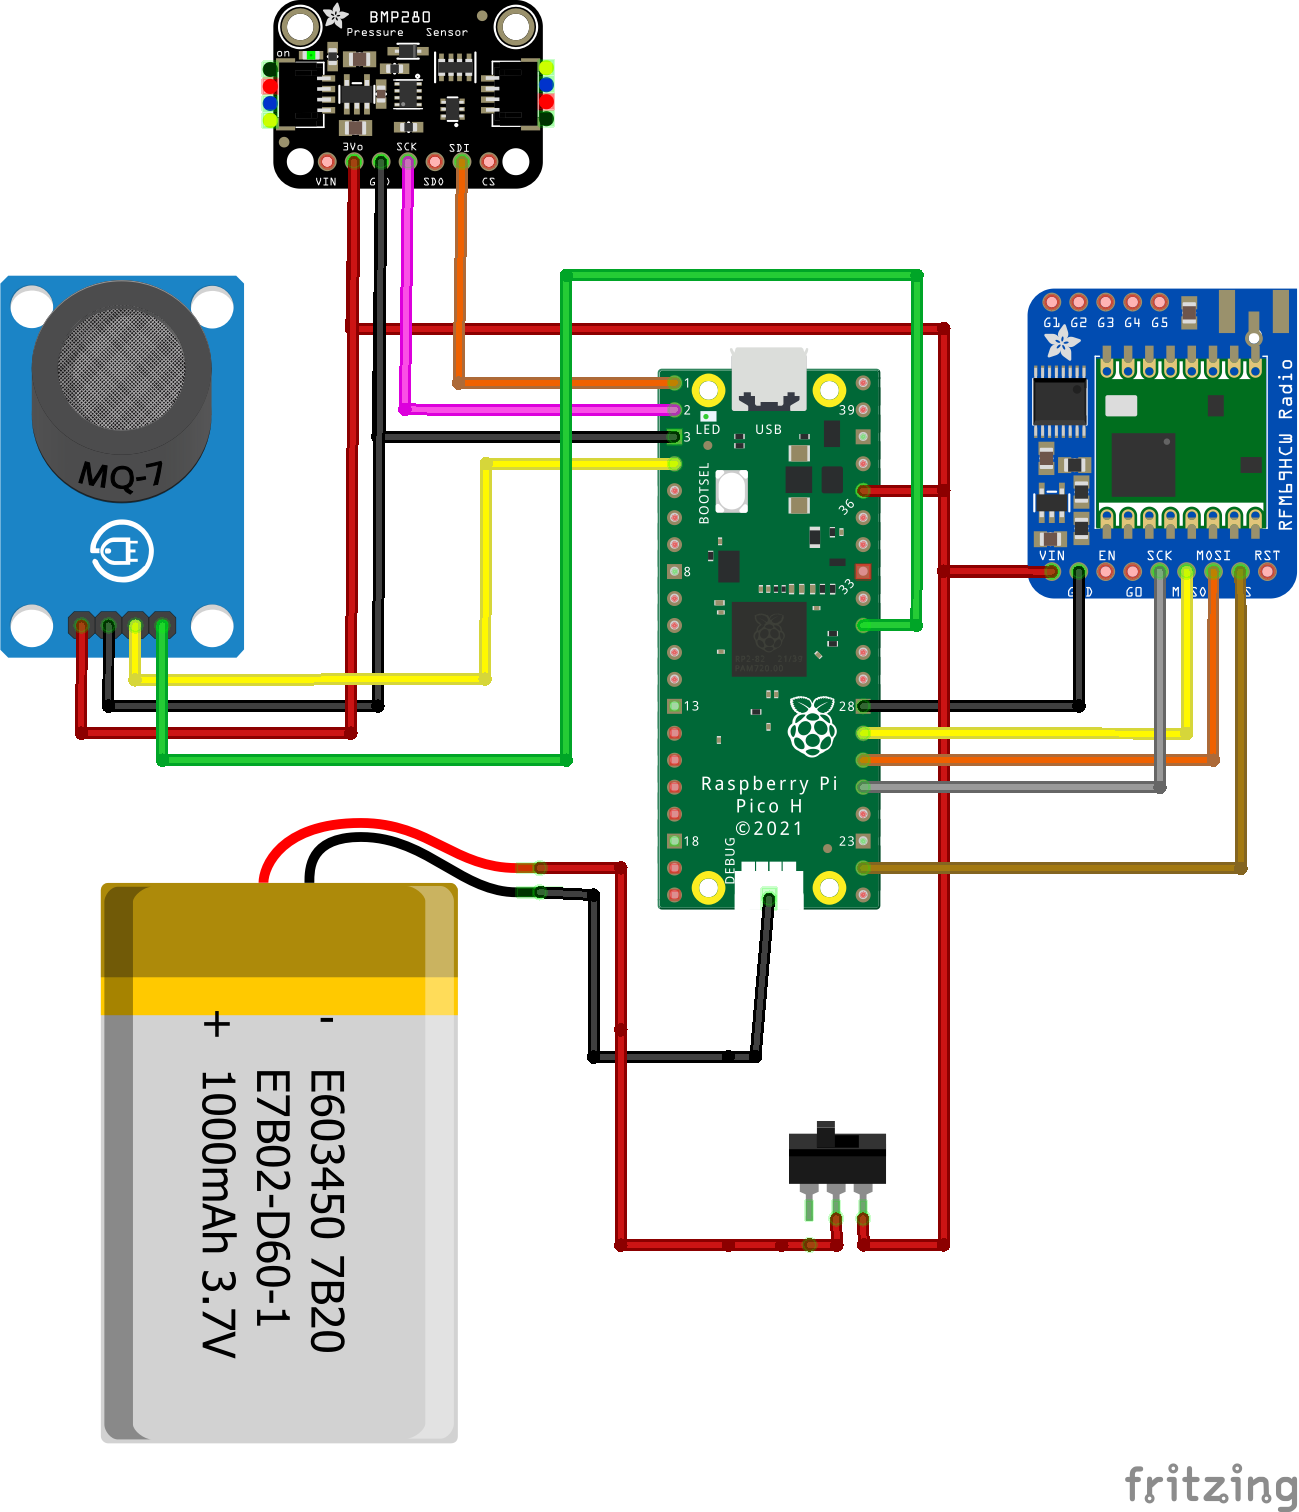
2.4.1 System overview
- BMP 280: Sensor to measure air pressure (Primary mission)
- MQ-7 gas sensor: Sensor to measure CO concentration (Secondary mission)
RFM69HCW: Radio communication with ground station.
2.4.2 Power consumptions
| Module | Expected power draw (mA) @ 5V |
| Raspberry Pi Pico | 50 mA |
| MQ-7 gas sensor | 70 mA |
| BMP 280 | 2.7µA @ 1 Hz sampling rate |
| RFM69HCW | 80 mA |
| Total | 200 mA |
2.5 Software design
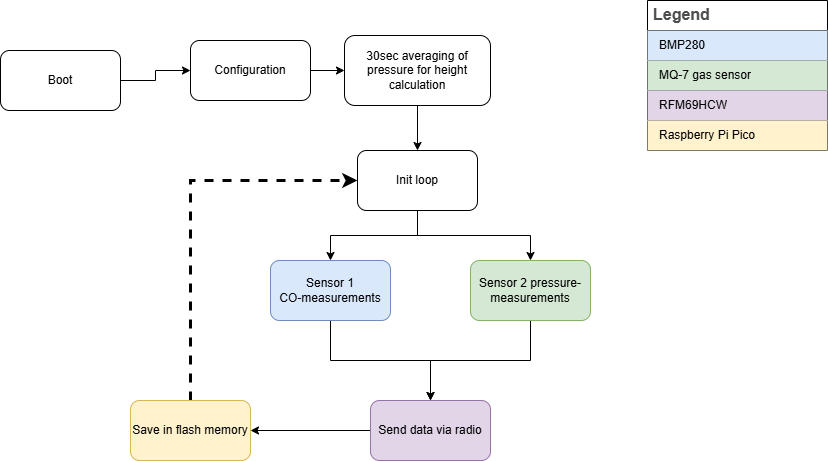
We first boot our project, after this we take a 30s average of the atmospheric pressure to calculate the starting height. Once the loop has started, we can launch. During the launch our Cansat will measure CO-particles, atmospheric pressure and temperature. Those measurements will be sent to the RFM69HCW and saved in the flash memory from our Pico. As there are no IF-ELSE conditions planned and no SD card system, there shouldn’t be any way for the software to crash or get stuck. The data will safely be appended to the flash memory file.
2.6 Ground station design & Data processing
2.6.1 Antenna & Data Capturing
As a ground station, we have a Raspberry Pi Pico with a 434MHz transceiver connected to a Yagi antenna to receive the radio packets from the CanSat. This ground station will save the received packages in flash as well as printing the packets to the shell. With this we can store all of our data in a CSV file which we can later process the data and use it to make graphs. In case packet transmission or receiving fails, as a backup we will also save the data on the flash memory on the Raspberry Pi Pico.
2.6.2 Data Processing
Our data processing will be conducted using Excel, a versatile tool that allows us to organize and analyze the collected data effectively. By using Excel’s capabilities, we can sort, filter, and process the raw data obtained from the MQ-7 and BMP280 sensors to uncover meaningful trends and relationships. One of the primary advantages of using Excel is its ability to create detailed and visually engaging graphs, which will be instrumental in representing the variations in CO concentration, atmospheric pressure, and temperature across different altitudes.
These graphs will serve as a visual summary of our findings, making it easier to identify key patterns and communicate the results in a clear and concise manner. Once the graphs are generated, they will be compiled and integrated into a visually appealing poster. This poster will function as a comprehensive conclusion, providing an accessible and informative summary of the project’s objectives and outcomes. The use of graphs and visual elements will enhance the clarity of our conclusions, ensuring that they are both impactful and easy to understand for a wide audience.
2.7 Recovery system
We are planning on using an external GPS tracker to locate the CanSat after the flight. This tracker will give us the exact coordinates from the Can once it lands. We are going to work with the TK-STAR GPS tracker. The tracker works with a sim card and we can connect it with our phone via an app to receive the GPS coordinates in real time. The tracker has a built-in battery so we don’t need to connect with our battery. When we send a signal to our tracker it gives us the exact location. The tracker weighs 168g. Our Cansat will also be orange for increased visibility and better recovery chances in case our gps tracker would not work.
3. Testing
3.1 Parachute
The parachute design will be an annular parachute as per the design of Peak of Flight (see appendix). We have run calculations for the ideal size of parachute to reach the required velocity range of 8m/s to 11m/s. We have now started construction of the parachute and will test the designs shortly using the height of our school building. The materials used are nylon rope and thin plastic sheets that we had from previous physics projects.
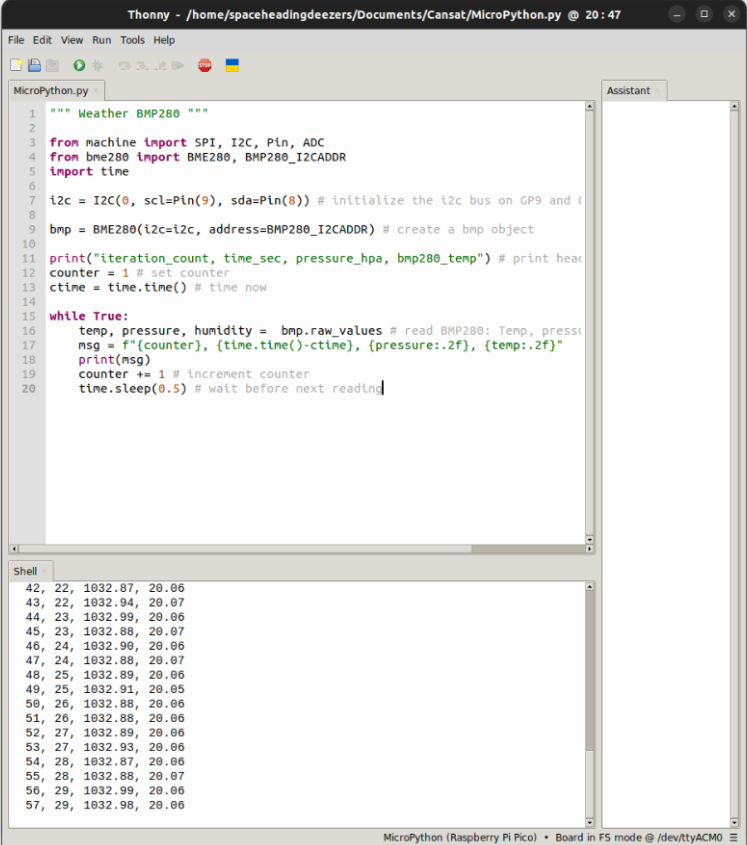
3.2 Primary mission
First of all, we had to set up our Raspberry Pi Pico so that we could code and work in it. This was the most challenging part because none of us had experience with this hardware.
We used the bme280 package on pypi and connected the bme280 sensor.
The measured data was shown in the shell. This code will be extended to also send the data using RFM69HCW and store the data in flash memory.
3.3 Secondary mission
For our secondary mission, we measure the CO concentration in the air during our flight using the MQ-7 gas sensor.
The sensor has been connected to the raspberry pi pico and requires no additional pypi package as we just have to measure the analog output of the sensor.
This sensor has been tested using separate code and valid measurements can be done after a short (20s) waiting period. The code has to be integrated into the bmp280 code, which will happen shortly now as our exams are now done.
3.4 Recovery
We tested our GPS module. This is a separate small box that tracks the position of the CanSat. We made sure it could also be tracked at the highest point of the flight.
4. Discussion
Our teamwork is progressing well. After initially facing some challenges in adapting to new team dynamics, we’ve now settled into a rhythm and are working together like a well-oiled machine. The difficulties we encountered were primarily due to the introduction of new teammates, who we were not used to working with. However, after a few days of adjusting, we were able to overcome these struggles.
Currently, we’re on track to complete the project on time, which is largely due to the ample time provided by the school to dedicate to the CanSat project. The primary challenge we’ve encountered so far has been related to the design of the can. However, despite some setbacks, we have managed to resolve the issue without losing too much time. Overall, things are moving forward smoothly, and we’re confident we can meet our deadlines.
5. Conclusion
Our initial goal was to measure the concentration of carbon monoxide (CO) particles in the air using an MQ-7 sensor and to analyze how high humans can construct buildings without being exposed to excessive CO levels. This objective was motivated by the increasing prevalence of urban high-rise construction and the need to ensure that these environments remain safe for human habitation. Carbon monoxide is a harmful gas that poses significant health risks when inhaled in excessive amounts, making its measurement and understanding at various altitudes a critical factor for urban planning and sustainability.
To support this effort and gain deeper insights into the factors influencing CO levels, we also integrated a BMP280 sensor into our project. This sensor is capable of measuring atmospheric pressure and temperature, two environmental variables that play a pivotal role in understanding the distribution and behavior of CO in the atmosphere. Pressure changes with altitude, while temperature variations can affect the dispersal and density of CO particles. The inclusion of this sensor allowed us to expand our scope and establish a clearer relationship between these variables and air quality.
However, as the launch of the experiment has yet to occur, there are currently no results available to report. This project is still in its preparatory stages, and the actual data collection process will begin once the sensors are fully deployed. Once the data is gathered, we will analyze the findings to draw meaningful conclusions about the relationship between altitude, environmental conditions, and CO concentration.